Road roughness is the #1 complaint of the driving public. In addition to reducing complaints, Smoother roads provide a variety of other benefits including:
- Lasting Longer – 25% smoother roads result in a 10% longer pavement life
Yielding up to 4.5% better fuel efficiency
Saving users on wear and tear – up to $126 yearly per vehicle
Safety – prevent loss of control and more consistent braking ability
Smooth roads stay smoother longer
Smoother roadways are accomplished by using Best Paving Practices including:
- Variable depth paving and cold planing with 2D automatic control systems or 3D automated machine guidance
- Limit variability in paving conditions by:
- Maintaining a constant head of material in front of the screed
- Optimizing the paving speed by using Delivery Monitoring and Automated Ticketing
- Limiting paver stops by monitoring with Paver Mounted Thermal Profiling and minimizing with Delivery Monitoring and Automated Ticketing
- Ensuring mix temperature uniformity by monitoring thermal segregation and material temperature behind the paver screed with Paver Mounted Thermal Profiling
Click icons below to learn how to improve best paving practices
How to Measure Smoothness
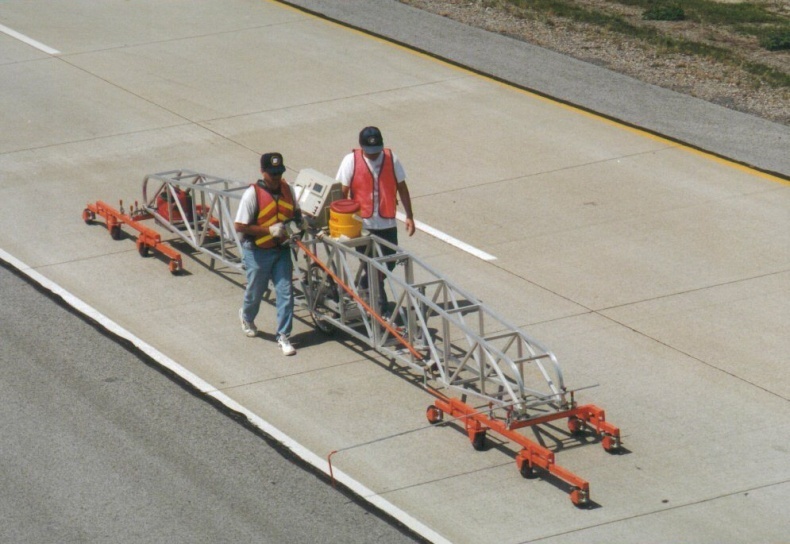
The profile of the roadway should be measured using an Inertial Profiler. Once completed, the profiles can be upload to the FHWA sponsored ProVAL engineering software application to determine the smoothness of longitudinal pavement profiles by a Rolling Straightedge Simulation, Profilograph Simulation or International Roughness Index.

Rolling Straightedge Simulation
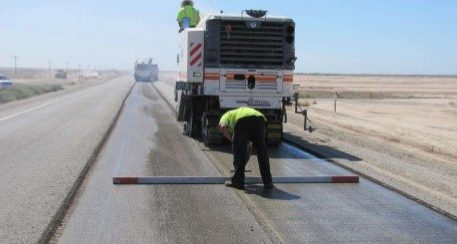
The rolling straight edge analysis determines vertical deviations between the center of a virtual straightedge of specified length and the pavement profile along every inch of both wheel paths. This method is useful in identifying localized roughness and is intended to comply with existing straightedge specifications by generating a report of all deviations over a specified height.
International Roughness Index (IRI)
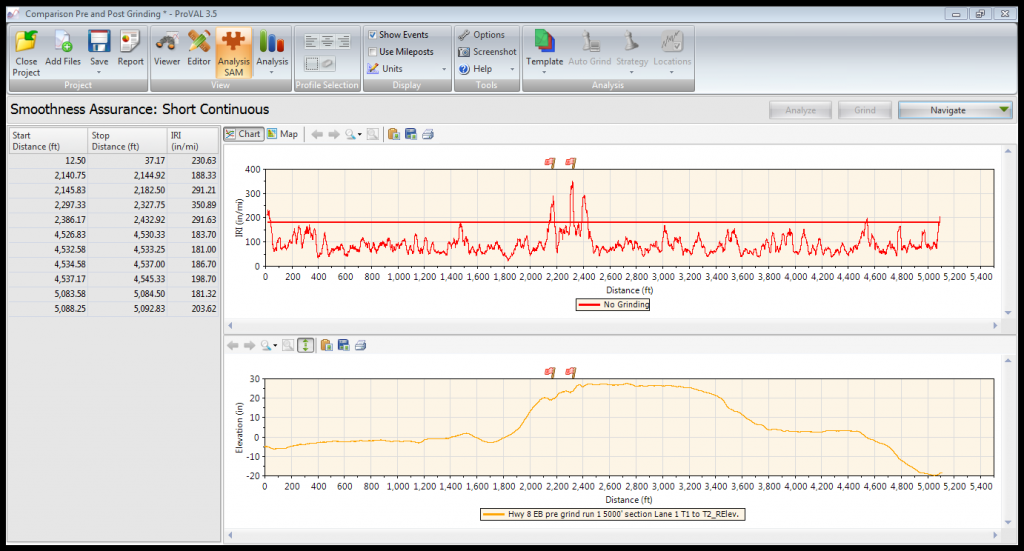
IRI is utilized to summarize qualities of pavement surface deviations (roughness) that impact vehicle suspension movement, ultimately affecting the comfort of the driver. Every inch of each wheel path has an IRI value associated with it, with higher values indicating rougher areas. IRI is the required form of measure by the US Federal Highway Administration and is used by highway professionals around the world. Units are either in in/mi or m/km.
Mean Roughness Index (MRI)
MRI is a long-interval form of measure utilizing the IRI to give one value by averaging smoothness over a specified distance, typically 0.10 mi, or 0.10 km. The value is calculated by averaging all IRI values in the specified length for both wheel paths. MRI is a form of measurement for overall roadway smoothness but does not identify localized roughness issues.
Area of Localized Roughness (ALR)
ALRs are individual roughness locations (caused by bumps or dips) where the IRI of the existing surface exceeds a specified IRI level. It is expressed by the peak IRI value. It is valuable to identify ALRs as they may be objectionable, and possibly hazardous, even if the roadway is otherwise smooth.


